By the end of this reading you should know the following:
Often when we get involved in complex scripting, some of the handlers don't function quite the way we anticipate. Sometimes they don't function at all. At times like this it is difficult to determine exactly where the problem is located. It is therefore useful to have means to somehow check the handlers as they execute in order to determine the problem and solve it.
Most of the errors we encounter are a result of mistyping on our part. The first line of defense against our own incompetence is the script editor itself. The script editor possesses several tools to help prevent a multitude of potential problems:
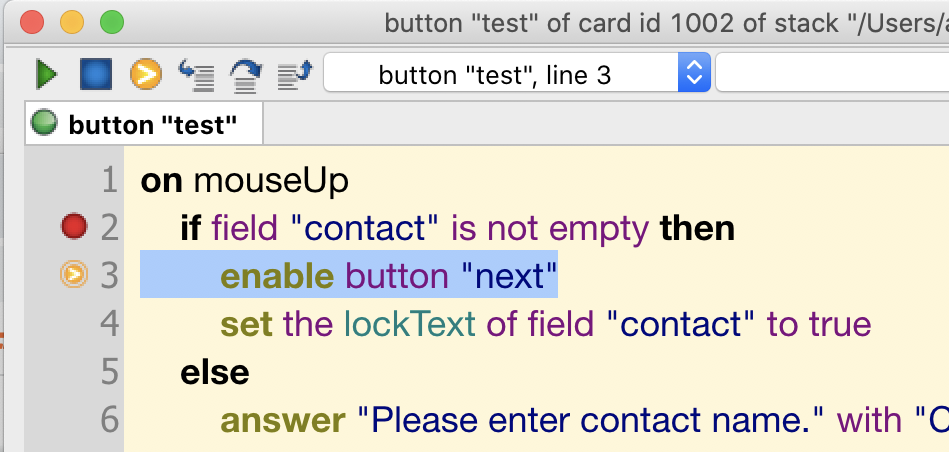
end mouseUp fails to line up with on mouseUp when we forget to close the if structure with end if. 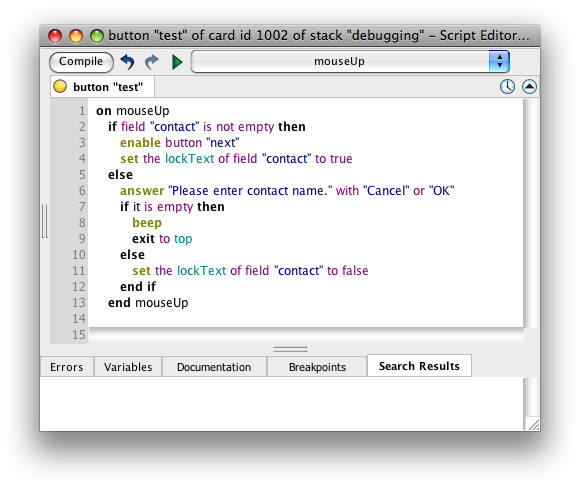 |
We can also use the script editor to comment out questionable lines or sections of a handler. This prevents them from executing and allows us to isolate the problem.
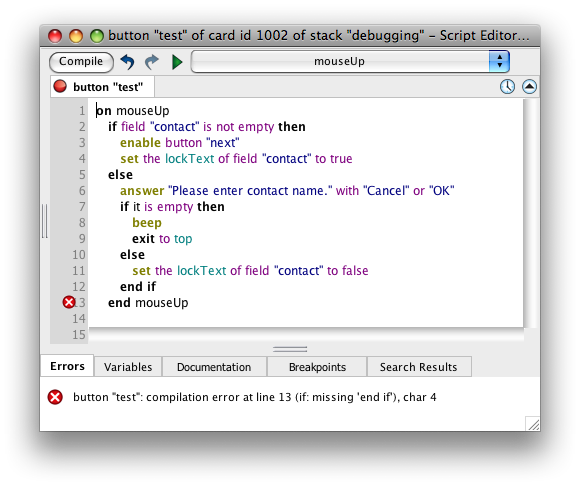
There are also errors that arise due to something wrong with the syntax we've input: commands, key words, labels, etc. In working with handlers, LiveCode first compiles commands when you click "Apply" to register your changes. During compilation the entire script is analyzed. If a compile error is found in any handler when a script is being compiled, the entire script is unavailable for execution until the error is corrected and the script is re-compiled. Many syntax errors show up in the compile stage. LiveCode then displays an error palette explaining what it thinks is wrong.
At right is the error dialog generated by the end if error above:
You have likely already encountered this several times while working on your own stacks. Clicking the close button in the titlebar will get rid of the error palette, and the Script button opens the script editor and highlights the offending line. Although LiveCode does a pretty good job of identifying the error, you can’t always trust an error message as it may only reflect the effects of the error, not the cause.
Beware reserved words. One particular type of syntax error occurs when we try to use a reserved word—that is, any term from the LiveCode language—for a variable name. In some cases, LiveCode, in trying to be user-friendly, will allow us to use, say, a command like put or a message name like openCard as a variable name, if the use is unambiguous. However, trying to use a property name (like visible), a function name (like random), or a constant (like return) as a variable will result in an error when you apply the script. Regardless of what LiveCode will let you get away with, it is best to scrupulously avoid using reserved words as variable names. There are a couple of things that can help you with this:
Some other common syntax errors:
This is incorrect:
put true into the visible of button "next
This is correct:
set the visible of button "next" to true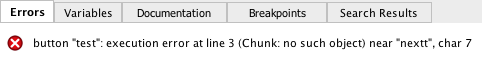
In many cases an statement can have the correct format, and therefore not produce a syntax error during compilation. Often these errors don't show up until you attempt to run and handler. Again, LiveCode will display an error dialog showing on which line in a handler the error was manifest and try to give an idea of the type of error. The execution error dialog will give you a choice of opening the Script to the place the error was manifest, Ignoring the error, or entering Debug mode.
Here are some common types of execution errors:
set the visible of button "next" to "hello"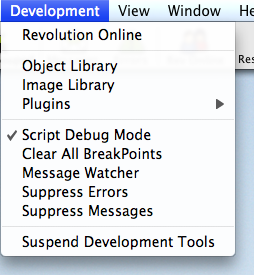
This feature is accessed from the Development menu and enables the debug environment. Here we have access to the Script Editor and debug tools. We select the object whose script we want to debug, open its script, and then locate the handler we want to debug.
A handler will run completely through all its statements unless we create a break point. This is accomplished by clicking in the vertical gray bar next to the line where we would like to start to watch the handler execute its commands discretely. A red dot appears to indicate that it's a break point. Then we run the handler by performing the event that initiates the message, such as clicking on a button to invoke its mouseUp handler. The handler begins to run then stops at the break point.
At this point we can step through the handler a line at a time with the Step Over button (keyboard shortcut Cmd/Cntl+O.) If we select the Variables tab at the bottom of the script editor window, we can see the values of all variables in the handler as the handler executes. This enables us to spot invalid values or other problems as the variables change, etc. The run button allows the handler to go on.
Stepping through a handler in debug mode.
Logic errors occur when something is wrong with the logic of the handler. They are also the most difficult to diagnose. The handler runs without error messages (because there is not a syntax problem), but the results are not quite right or what we were expecting. Some are quite obvious: forgetting to initialize a variable so results get added to a previous run, or typing the name of a variable incorrectly.
As you probably noticed in your own efforts, we often introduce logic errors when we add new features to an application. Consequently it pays to think through the logic each line of new code that we introduce. This often saves a lot of time debugging the logic later.
Since logic errors don't generate an error message, usually the only way to solve them is to employ break points and step through the handler, as described above.
As you have no doubt discovered, script debugging can be the most time consuming and frustrating part of programming, mainly because there are seemingly limitless ways to mess up a script. The only way to get through the initial frustrations of encountering many bugs, is to write lots of handlers and work through the debugging process. Over time you will find yourself making fewer errors, because the scripting-testing-debugging-retesting process will train you to avoid common errors.
To paraphrase King Benjamin: "I cannot tell you all the things whereby ye may introduce bugs; for there are divers ways and means, even so many that I cannot number them.
"But this much I can tell you, that if ye do not watch your typing, and your handler names, and your variables, and your if structures, and observe proper LiveCode syntax, and continue in writing many good handlers because of what ye have heard concerning the coming of the Final, even unto the end of the semester, ye must crash. And now, O programmer, remember, and crash not."